Malware is still the part of the attack that does the damage. Phishing gets the attacker in and stolen credentials get them further, but it is the ransomware binary, the infostealer or the backdoor that encrypts the file server, lifts the passwords or keeps the door open for the next group. The UK data for 2025 and 2026 shows a threat that is less common than the headlines suggest for the typical small business, and far more concentrated and expensive for the organisations it does reach.
In this article we have pulled together the latest malware statistics from the sources that actually hold the data: the government’s Cyber Security Breaches Survey, the ICO’s incident dataset (which we count ourselves), the NCSC, the National Crime Agency, Report Fraud, and the vendor and incident response reports that publish their methodology, including Verizon, Mandiant, Sophos, Coveware, Kaspersky, Microsoft, Check Point and ENISA. UK figures come first in each section. Where a figure is global, European or US-weighted we say so in the line itself, because a lot of the malware numbers that circulate online are American telemetry quoted as if they applied here.
The page is organised around the questions people ask: how common malware is in the UK, how much malware exists, what the ransomware picture looks like, what infostealers are doing to credentials, how malware gets in, which platforms and sectors it hits, which families dominate, and what it costs.
Key malware statistics for 2026 at a glance
- 7% of UK businesses and 3% of UK charities had devices targeted with viruses, spyware or other malware in the last 12 months, rising to 23% of large businesses; ransomware affected 1% of businesses, down from 3% in each of the two previous years (Cyber Security Breaches Survey 2025/26, DSIT, April 2026).
- Organisations reported 617 ransomware incidents and 102 other malware incidents to the ICO in 2025, out of 3,153 cyber incident reports. Ransomware reports have halved since the 2023 peak of 1,253 (our count of the ICO data security incident trends dataset).
- The NCSC handled 429 incidents in the year to August 2025, 204 of them nationally significant, more than double the 89 of the year before, and calls ransomware “the most immediate, disruptive threat” to critical national infrastructure (NCSC Annual Review 2025).
- UK organisations made 323 ransomware reports to Report Fraud between April 2025 and March 2026, 175 of them from SMEs (City of London Police, June 2026).
- Compromised credentials were the most common technical root cause of UK ransomware attacks at 28%, ahead of malicious email (25%), phishing (22%) and exploited vulnerabilities (18%, down from 36%) (Sophos State of Ransomware in the UK 2026).
- Ransomware featured in 52% of the UK cyber incidents handled by Pinsent Masons in 2025, and the Akira group alone appeared in 26% of cases (Pinsent Masons Cyber Annual Report 2026).
- Ransomware was present in 48% of the 22,000 confirmed breaches analysed worldwide, and a malware action of some kind in 63% (Verizon DBIR 2026, global).
- 73% of ransomware victims had an infostealer infection or credential leak in the year before the attack, half of them within 95 days (Verizon DBIR 2026, global).
- Kaspersky detected an average of 500,000 malicious files a day in 2025, up 7%, with password stealer detections up 59% and spyware up 51% (Kaspersky Security Bulletin 2025, global telemetry).
1. How common is malware in the UK?
The best measure of prevalence is the Cyber Security Breaches Survey, which DSIT runs every year with around 2,100 businesses and 1,100 charities. The 2025/26 edition was published on 30 April 2026. It asks about any malware the organisation noticed, including the commodity stuff that antivirus catches, so it measures exposure rather than successful infection.
- 7% of UK businesses and 3% of charities identified devices being targeted with malware such as viruses or spyware in the last 12 months, making malware the third most common breach type after phishing (38%) and impersonation (12%) (CSBS 2025/26).
- Exposure scales with size: 7% of micro and small businesses, 12% of medium and 23% of large businesses reported malware. 10% of charities with income of £500,000 or more did, against 2% of the smallest (CSBS 2025/26).
- Among the 43% of businesses that identified any breach or attack, 16% said it involved malware and 3% ransomware. For charities the figures were 12% and 3% (CSBS 2025/26).
- Malware was the single most disruptive breach for 4% of affected businesses and ransomware for 1%; phishing took 69% of that vote (CSBS 2025/26).
- 81% of businesses and 63% of charities run up-to-date malware protection, up from 77% of businesses a year earlier (CSBS 2025/26).
- The ICO received 3,153 cyber-related personal data breach reports in 2025. Ransomware was 617 of them (19.6%) and other malware 102 (3.2%). In 2023 ransomware alone was 37.8% of cyber reports (our count of the ICO dataset, Q1 2019 to Q4 2025).
- The NCSC’s Early Warning service sent around 131,000 reports to the IP addresses of 1,350 UK organisations suspected of being compromised by malware or hacking in the year to August 2025 (NCSC Annual Review 2025).
- The NCA recorded 547 ransomware incidents reported to it between November 2023 and October 2024, against 560 the year before, and says ransomware “continues to be the major cybercrime threat to the UK” (NCA National Strategic Assessment 2025).
Our view is that the 7% and 1% figures understate what a mature organisation sees, because the survey sample is dominated by micro businesses with a handful of laptops. The large-business figures of 23% for malware and 7% for ransomware are the ones to benchmark against if you run an IT estate of any size.
Suggested Read: Small Business Cyber Security Statistics
2. Malware volume: how much malware exists
Nobody counts every malware sample, so volume figures come from the test labs and vendors that run large sensor networks. They disagree because they measure different things (unique files, detections, blocked attempts, attacks per organisation). We give each with its basis and do not add them together.
- The AV-TEST Institute registers over 450,000 new malicious programs and potentially unwanted applications every day (AV-TEST, 2026). Its cumulative count stood at roughly 1.35 billion malware and PUA samples at the end of 2024, around 1.1 billion of them malware, read from its published chart.
- Kaspersky detected an average of 500,000 malicious files per day between November 2024 and October 2025, a 7% increase (Kaspersky Security Bulletin 2025, Kaspersky Security Network telemetry).
- Microsoft blocks approximately 4.5 million new malware attempts a day and processes more than 100 trillion security signals daily (Microsoft Digital Defense Report 2025).
- Organisations faced an average of 1,968 attack attempts per week in 2025, 18% more than in 2024 and 70% more than in 2023 (Check Point Cyber Security Report 2026, Check Point telemetry). By September 2026 that had reached 2,803 weekly attacks per organisation, up 48% year on year, with Europe the fastest-rising region at 61% (Check Point, October 2026).
- SonicWall logged 13.15 billion high and medium severity attack hits across its sensors in 2025, up 20.8% (SonicWall 2026 Cyber Protect Report, SonicWall telemetry).
Suggested Read: Cyber Security Statistics
3. Ransomware in the UK: the short version
Ransomware is the malware class that produces the ICO reports, the insurance claims and the headlines, and it now has its own page in this series. The figures below are the ones the malware picture needs; the full set (how attacks start and end, demands and payment rates, incident costs, leak-site volumes, the most active groups and a dated table of UK incidents) is on our ransomware statistics page.
- 1% of UK businesses and 1% of charities had devices targeted with ransomware in the last 12 months, down from 3% of businesses in each of the two previous years; 7% of large businesses did (CSBS 2025/26).
- Organisations reported 617 ransomware incidents to the ICO in 2025, down from 752 in 2024 and 1,253 in 2023, alongside 102 other malware reports (our count of the ICO dataset).
- 323 UK organisations reported a ransomware attack to Report Fraud between April 2025 and March 2026, 175 of them SMEs (City of London Police, June 2026).
- Ransomware was present in 48% of breaches analysed worldwide, the highest in the report’s history, and 69% of victims did not pay (Verizon DBIR 2026, global).
- The mean UK recovery cost from a ransomware attack, excluding any ransom, was $1.49 million in 2026 (Sophos State of Ransomware in the UK 2026).
Suggested Read: Ransomware Statistics
4. Infostealers and credential theft: the 2025 to 2026 story
If ransomware is the malware that ends an incident, infostealers are increasingly the malware that starts one. An infostealer is a small piece of malware, usually delivered through a cracked download, a fake update or a malicious advert, that harvests saved browser passwords, session cookies and tokens from a device and sends them to a criminal marketplace. The buyer then logs in rather than breaks in.
- 73% of ransomware victims had an infostealer infection or other credential leak in the year before they were posted as a victim, and for half of them the leak happened within 95 days of the attack. Small organisations saw a median of seven credential leak events a year; large ones saw 20 (Verizon DBIR 2026, global).
- Kaspersky’s detections of password stealers rose 59% and spyware 51% in 2025. In Europe the rises were 48% and 64%, with backdoors up 50% (Kaspersky Security Bulletin 2025).
- More than 11.1 million devices were infected with infostealers in 2025, and over 3.3 billion stolen credentials, session cookies, cloud tokens and other identity records are circulating on criminal markets. Subscriptions start at around $60 a month (Flashpoint 2026 Guide to Infostealers, global).
- The Lumma infostealer was deployed on around 394,000 Windows machines between March and May 2025 before a law enforcement operation seized about 1,300 domains; its use had risen more than 350% between the first and second halves of 2024 (ENISA Threat Landscape 2025).
- Ransomware, banking trojans and infostealers together made up 87.3% of cybercriminal intrusions recorded against EU organisations (ENISA Threat Landscape 2025).
- More than 97% of the identity attacks Microsoft observed were password attacks, and identity-based attacks rose 32% in the first half of 2025 (Microsoft Digital Defense Report 2025).
- 79% of ransomware attacks worldwide began with a compromised identity, and 97% of organisations breached through compromised credentials had MFA deployed in some form (Sophos State of Ransomware 2026).
In our penetration testing work this is the pattern we see most often on internal engagements: a credential harvested from a personal or unmanaged device, reused on a corporate VPN or Microsoft 365 account, with MFA enforced for most users but not for the service account, the contractor or the legacy mailbox the attacker actually picks. The infostealer never touches the corporate network. The stolen password does.
Suggested Read: Social Engineering Statistics
5. How malware spreads: delivery methods in 2025 and 2026
Malware still arrives mainly by email, but the 2025 and 2026 reports show the mix shifting towards exploited edge devices, remote access tools and browser-based tricks such as ClickFix, where the victim is talked into pasting a command into their own machine. Phishing rates belong on our phishing statistics page; here we only cover email as a malware channel.
- Email accounted for 82% of malicious file deliveries to organisations in 2025 and web downloads for 18%. 46% of all emails with attachments received by organisations were malicious, and ClickFix activity rose by around 500% (Check Point Cyber Security Report 2026, Check Point telemetry).
- Exploitation of vulnerabilities was the initial access vector in 31% of breaches, ahead of phishing (16%) and credential abuse (13%) for the first time. Attacker use of remote management tools rose 240% while backdoor and command-and-control activity fell 27% (Verizon DBIR 2026, global).
- Among SMB ransomware victims, compromised credentials (38%) and unpatched edge devices (29%) were the two routes in, and VPNs were the vector in around 16% of System Intrusion breaches (Verizon DBIR 2026).
- Exploits were the most common initial infection vector for the sixth year running at 32% of Mandiant investigations; voice phishing rose to 11% and email phishing fell to 6% from 14% (Mandiant M-Trends 2026).
- Phishing in its broad sense (malspam, vishing and malvertising) was behind about 60% of intrusions in the EU, and vulnerability exploitation behind 21.3%, with 68% of those exploits leading to malware deployment (ENISA Threat Landscape 2025).
- 33% of Kaspersky’s users met an on-device threat in 2025, a category that includes malware spread via removable drives and hidden inside installers and encrypted archives (Kaspersky Security Bulletin 2025).
- Honeywell’s industrial USB scanning detected 1,826 unique USB-borne threats in the first quarter of 2025, 124 of them never seen before, and the Ramnit worm accounted for 37% of files blocked (Honeywell 2025 Cyber Threat Report, operational technology sites).
Suggested Read: Phishing Statistics
6. Malware by platform: Windows, macOS, Android, IoT and Linux
- 48% of Windows users and 29% of macOS users in Kaspersky’s network encountered a threat in 2025; 27% of all users met a web-based threat (Kaspersky Security Bulletin 2025, global).
- Windows accounts for the large majority of the 450,000-plus new samples AV-TEST registers each day, according to its published platform charts (AV-TEST, 2026).
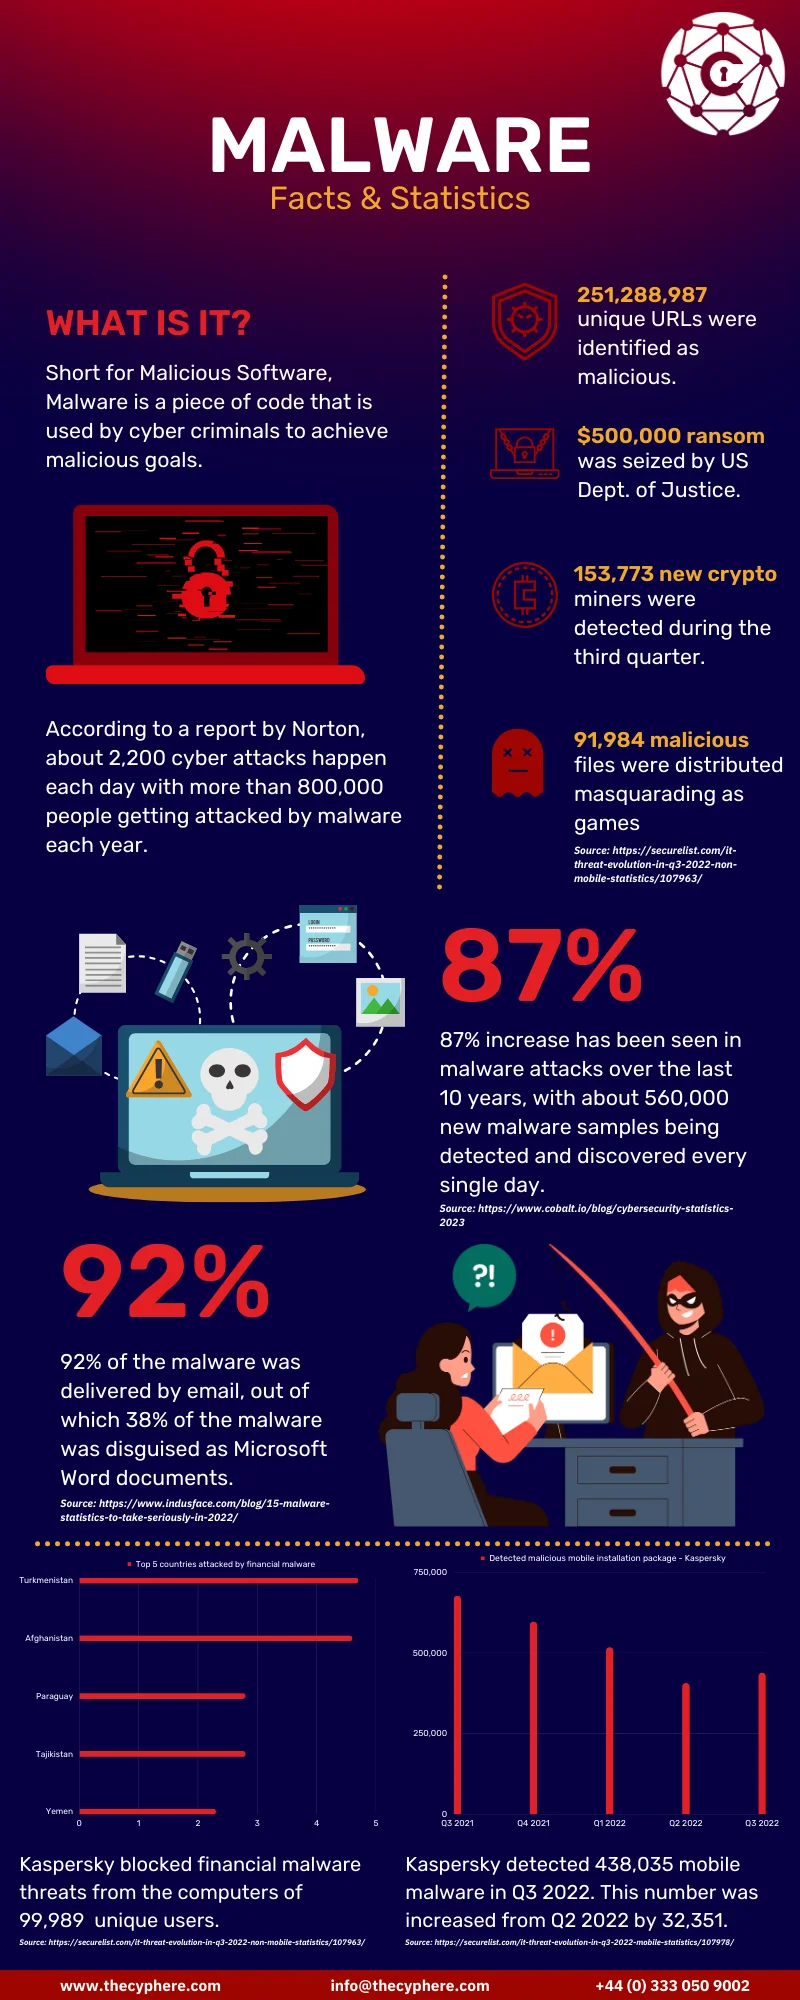
- Kaspersky blocked 14,059,465 attacks on Android devices in 2025 and observed 815,735 new malicious installation packages, nearly a third fewer than in 2024. New banking trojan packages rose to 255,090 and banking trojan attacks grew 1.5 times, with the Mamont family making up 49.8% of banking trojan apps. Adware was 62% of mobile detections (Kaspersky mobile malware evolution 2025, March 2026).
- IoT attacks reached 610 million hits in 2025, up 11%, and Log4j alone generated 824.9 million intrusion prevention hits four years after disclosure (SonicWall 2026 Cyber Protect Report).
- IoT devices were the entry point in 3% of ransomware attacks that began with a vulnerability, credential or brute force, against 38% for exposed applications, 30% for user devices, 21% for firewalls and 8% for VPNs (Sophos State of Ransomware 2026, global).
- Infostealers remain overwhelmingly a Windows problem: Lumma’s 394,000 infections over three months of 2025 were all Windows machines (ENISA Threat Landscape 2025).
We have not found a 2025 or 2026 primary source that publishes Linux or iOS malware counts with a methodology, so we have left them out rather than repeat vendor marketing figures.
7. Malware and ransomware by sector in the UK
The ICO dataset is the only UK source that gives sector counts for reported ransomware and malware. Because it records personal data breaches, it skews towards organisations that hold a lot of customer data.
- Retail and manufacture reported 227 ransomware incidents to the ICO in 2025, 37% of the total and almost unchanged from 230 in 2024. Finance, insurance and credit reported 76, education and childcare 44, legal 42, online technology and telecoms 39, land or property services 39, transport and leisure 32, health 22 and local government 19 (our count of the ICO dataset).
- The biggest falls were in health (78 ransomware reports in 2024 to 22 in 2025), education (82 to 44) and local government (41 to 19) (our count of the ICO dataset).
- For non-ransomware malware, retail and manufacture led with 34 of the 102 reports, followed by online technology and telecoms (14), charities (8) and education (8) (our count of the ICO dataset).
- 67% of UK higher education institutions and 11% of secondary schools had devices targeted with malware in the last 12 months, and 16% of higher education institutions were targeted with ransomware, against 7% and 1% for businesses overall. The higher education base is 49 institutions, so treat the percentages as indicative (CSBS 2025/26 education institutions data tables).
- Manufacturing (42 reports), scientific and technical (21) and education (19) were the sectors most often named in ransomware reports to Report Fraud in the year to March 2026 (City of London Police, June 2026).
- Academia, finance, engineering, retail and manufacturing were the sectors most often reporting ransomware to the NCSC, which adds that “no sector (and no organisation) is exempt” (NCSC Annual Review 2025).
Suggested Read: Healthcare Cyber Attack Statistics
8. Top malware families and types in 2025 and 2026
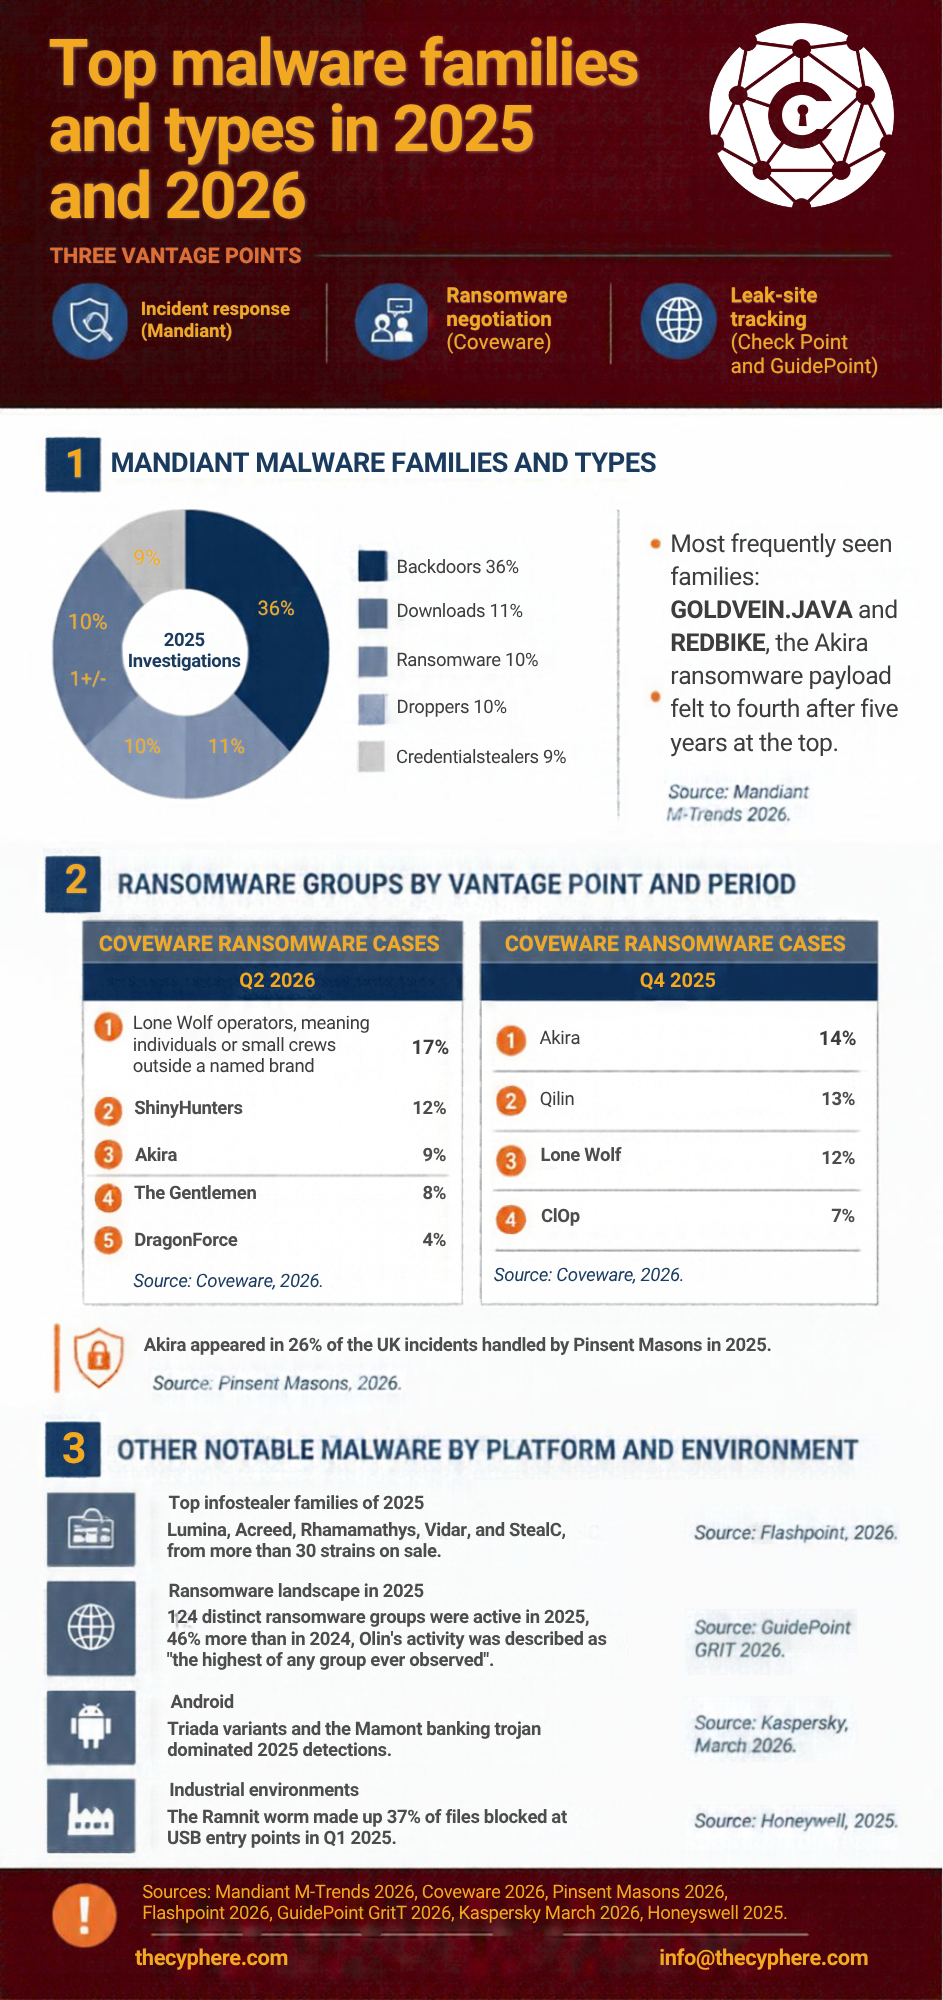
Lists of “top malware” vary with who is counting and where their sensors sit. The figures below come from three vantage points: incident response (Mandiant), ransomware negotiation (Coveware) and leak-site tracking (Check Point and GuidePoint).
- By category, Mandiant’s 2025 investigations found backdoors in 36% of malware families observed, downloaders 11%, ransomware 10%, droppers 10% and credential stealers 9%. The most frequently seen families were the GOLDVEIN.JAVA downloader and REDBIKE, the Akira ransomware payload; Cobalt Strike BEACON fell to fourth after five years at the top (Mandiant M-Trends 2026).
- Lone Wolf operators (individuals or small crews outside a named brand) took 17% of Coveware’s Q2 2026 cases, followed by ShinyHunters (12%), Akira (9%), The Gentlemen (8%) and DragonForce (4%). In Q4 2025 the order was Akira 14%, Qilin 13%, Lone Wolf 12% and Cl0p 7% (Coveware, 2026).
- Akira appeared in 26% of the UK incidents Pinsent Masons handled in 2025 (Pinsent Masons, 2026).
- The top infostealer families of 2025 were Lumma, Acreed, Rhadamanthys, Vidar and StealC, from more than 30 strains on sale (Flashpoint, 2026).
- 124 distinct ransomware groups were active in 2025, 46% more than in 2024, and Qilin’s activity was “the highest of any group ever observed” (GuidePoint GRIT 2026).
- On Android, Triada variants and the Mamont banking trojan dominated 2025 detections (Kaspersky, March 2026); in industrial environments the Ramnit worm made up 37% of files blocked at USB entry points in Q1 2025 (Honeywell, 2025).
Suggested Read: Penetration Testing Statistics
9. The cost of malware and ransomware
- The median cost of the most disruptive breach for UK businesses was £0, because most incidents are phishing emails that go nowhere. The 95th percentile was £4,000 for all businesses and £10,000 for medium and large ones (CSBS 2025/26).
- The mean UK recovery cost from a ransomware attack, excluding any ransom, was $1.49 million in 2026 and the global figure $1.7 million; incident-level costs such as the 2025 retail and JLR events are on our ransomware statistics page (Sophos UK 2026; Sophos 2026).
- The global average cost of a data breach fell to $4.44 million in 2025, the first decline in five years, but ransomware and extortion incidents averaged $5.08 million when the attacker disclosed them; 63% of victims refused to pay, up from 59% (IBM Cost of a Data Breach Report 2025, global).
Frequently asked questions
How common are malware attacks in the UK?
7% of UK businesses and 3% of charities identified malware such as viruses or spyware on their devices in the last 12 months, and 1% of each were targeted with ransomware. Among large businesses the figures rise to 23% and 7% (Cyber Security Breaches Survey 2025/26).
How many malware attacks happen every day?
There is no single count. AV-TEST registers over 450,000 new malicious programs and PUA a day, Kaspersky detected 500,000 malicious files a day in 2025 and Microsoft blocks around 4.5 million malware attempts a day. These measure new samples, detections and blocked attempts respectively.
How many ransomware attacks were there in the UK in 2025?
Organisations reported 617 ransomware incidents to the ICO in 2025 (our count), 323 to Report Fraud in the year to March 2026, and the NCA recorded 547 in the year to October 2024. All three sources say the true figure is higher, and the survey data puts prevalence at 1% of businesses.
What is the most common type of malware in 2026?
In breach data, ransomware: it appears in 48% of confirmed breaches (Verizon DBIR 2026). In incident response data, backdoors were the largest category at 36% of malware families (Mandiant M-Trends 2026). In mobile telemetry, adware and trojans dominate (Kaspersky, 2025).
How does most malware get in?
Email still delivers 82% of malicious files (Check Point 2026), but the fastest-growing routes are exploited vulnerabilities in edge devices (31% of breaches, Verizon DBIR 2026) and stolen credentials harvested by infostealers (73% of ransomware victims had one in the prior year).
How much does a malware or ransomware attack cost a UK business?
For most it costs very little: the median most disruptive breach cost £0 (CSBS 2025/26). Where ransomware takes hold, the mean UK recovery cost was $1.49 million before any ransom (Sophos UK 2026), and the two biggest 2025 incidents cost the UK economy an estimated £2.2 billion to £2.3 billion combined (Cyber Monitoring Centre).
About this data
This page draws on reports published between June 2025 and October 2026. UK prevalence figures are from the DSIT Cyber Security Breaches Survey 2025/26 (fieldwork autumn 2025, published 30 April 2026), including its education institutions data tables. ICO figures are our own count of unique incident references in the ICO’s published data security incident trends dataset, Q1 2019 to Q4 2025, and will differ slightly from counts that use rows rather than references. UK incident figures come from the NCSC Annual Review 2025, the NCA National Strategic Assessment 2025, City of London Police, Pinsent Masons and the Cyber Monitoring Centre. Global and European figures come from Verizon, Mandiant, ENISA, Microsoft, Sophos, Coveware, Check Point, Travelers, GuidePoint, Flashpoint, Kaspersky, AV-TEST, SonicWall, Honeywell and IBM; where a report is vendor telemetry we have said so, and leak-site counts are given from more than one tracker because their site lists differ.
Older figures from 2021 and 2022 that appeared in previous versions of this page, including the country infection league tables and the 2022 Kaspersky mobile data, have been removed. We refresh this page after each Cyber Security Breaches Survey (April), each ICO dataset release (quarterly), the NCSC Annual Review (autumn) and the Verizon DBIR (spring).
If you cite a figure from this page, please link to the original source as well as to us; the references are below.
References
- DSIT, Cyber Security Breaches Survey 2025/26 (30 April 2026)
- DSIT, Cyber Security Breaches Survey 2025/26 data tables (ODS)
- ICO, Data security incident trends dataset (Q1 2019 to Q4 2025)
- NCSC Annual Review 2025
- City of London Police, ransomware warning (29 June 2026)
- NCA, National Strategic Assessment 2025
- Sophos, State of Ransomware in the UK 2026
- Pinsent Masons, Cyber Annual Report 2026
- Verizon, 2026 Data Breach Investigations Report
- Kaspersky, Security Bulletin 2025 statistics (2 December 2025)
- Kaspersky, “The number of the year” press release (2 December 2025)
- Kaspersky, Mobile malware evolution in 2025 (4 March 2026)
- GuidePoint Security, GRIT 2026 Ransomware and Cyber Threat Report (15 January 2026)
- AV-TEST Institute, malware statistics
- Microsoft, Digital Defense Report 2025 (16 October 2025)
- Check Point, Cyber Security Report 2026 summary (28 January 2026)
- Check Point, September 2026 threat report (8 October 2026)
- SonicWall, 2026 Cyber Protect Report release (31 March 2026)
- ENISA, Threat Landscape 2025 (1 October 2025, v1.3 September 2026)
- Coveware, Q4 2025 report (3 February 2026)
- Coveware, Q2 2026 report (29 July 2026)
- Sophos, State of Ransomware 2026 (July 2026)
- Flashpoint, 2026 Guide to Infostealers
- Mandiant (Google Cloud), M-Trends 2026 executive edition (March 2026)
- Honeywell, 2025 Cyber Threat Report release (4 June 2025)
- IBM, Cost of a Data Breach Report 2025, UK findings (30 July 2025)