Penetration testing is the one security control that tells you what an attacker could actually do with your systems, rather than what a policy says should happen. It is also one of the least adopted: in the UK, fewer than one business in seven commissioned a penetration test in the last year, while the number of published vulnerabilities rose by more than 60% between 2023 and 2025 and is still climbing.
In this article we have pulled together the latest statistics on penetration testing from the sources that hold the data: the government’s Cyber Security Breaches Survey, DSIT’s sector and skills reports, the NCSC, CREST, the CVE and NVD records, CISA’s Known Exploited Vulnerabilities catalogue, and the testing platforms and incident responders that publish their methodology. UK figures come first in each section. Where a figure is global or US-weighted we say so in the line, because most of the pen testing numbers that circulate online are American survey data quoted as if they applied here.
The page is organised around the questions people ask about this subject: how many UK organisations test, what the UK testing industry looks like, how many vulnerabilities there are and how many get exploited, how attackers really get in, what tests find and how quickly it gets fixed, and why organisations test at all.
Key penetration testing statistics for 2026 at a glance
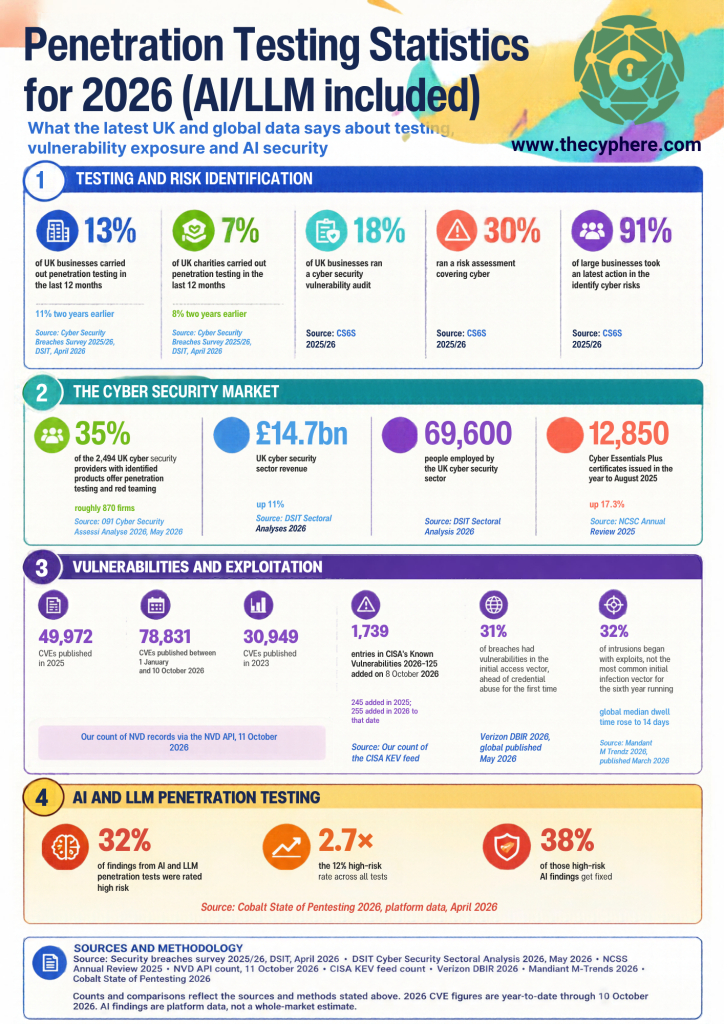
- 13% of UK businesses and 7% of UK charities carried out penetration testing in the last 12 months, up from 11% and 8% two years earlier (Cyber Security Breaches Survey 2025/26, DSIT, April 2026).
- 18% of UK businesses ran a cyber security vulnerability audit and 30% a risk assessment covering cyber; 91% of large businesses took at least one action to identify cyber risks (CSBS 2025/26).
- 35% of the 2,494 UK cyber security providers with identified products offer penetration testing and red teaming, roughly 870 firms (DSIT Cyber Security Sectoral Analysis 2026, May 2026).
- The UK cyber security sector generated £14.7 billion of revenue, up 11%, and employs 69,600 people (DSIT Sectoral Analysis 2026).
- 12,850 Cyber Essentials Plus certificates were issued in the year to August 2025, up 17.3% (NCSC Annual Review 2025).
- 49,972 CVEs were published in 2025 and 78,831 between 1 January and 10 October 2026, against 30,949 in 2023 (our count of the NVD records via the NVD API, 11 October 2026).
- CISA’s Known Exploited Vulnerabilities catalogue held 1,739 entries on 8 October 2026; 245 were added in 2025 and 255 in 2026 to that date (our count of the CISA KEV feed).
- Vulnerability exploitation was the initial access vector in 31% of breaches, ahead of credential abuse for the first time (Verizon DBIR 2026, global, published May 2026).
- Exploits were the most common initial infection vector for the sixth year running at 32% of intrusions, and the global median dwell time rose to 14 days (Mandiant M-Trends 2026, published March 2026).
- 32% of findings from AI and LLM penetration tests are rated high risk, 2.7 times the 12% rate across all tests, and only 38% of those high-risk AI findings get fixed (Cobalt State of Pentesting 2026, platform data, April 2026).
What is penetration testing?
A penetration test is an authorised, controlled attempt to break into a system, application or network the way a real attacker would, using the same techniques, to find and demonstrate weaknesses before someone else does. The output is a report of what was found, how serious it is and what to fix first, not a scan printout. The penetration testing services page explains the types of test and how an engagement runs; this page sticks to the numbers.
1. How many UK businesses do penetration testing?
The only official measure of UK take-up is the Cyber Security Breaches Survey, which DSIT runs every year with the Home Office. The 2025/26 edition surveyed 2,112 businesses and 1,085 charities between August and December 2025 and was published on 30 April 2026. It asks which actions organisations took in the last 12 months to identify cyber risks, and penetration testing is one of them.
| Action taken in the last 12 months | Businesses 2023/24 | Businesses 2024/25 | Businesses 2025/26 | Charities 2025/26 |
|---|---|---|---|---|
| Any of the listed actions | 51% | not stated | 52% | 38% |
| Security monitoring tools | 33% | 30% | 32% | 19% |
| Risk assessment covering cyber | 31% | 29% | 30% | 27% |
| Staff testing, such as mock phishing | not listed | not listed | 22% | 13% |
| Cyber security vulnerability audit | 17% | 15% | 18% | 10% |
| Penetration testing | 11% | 12% | 13% | 7% |
| Threat intelligence | 10% | 9% | 11% | 6% |
Source: DSIT Cyber Security Breaches Survey, Figure 3.1 in the 2024, 2025 and 2025/26 editions.
- Penetration testing has crept up by one point a year for businesses: 11% in 2024, 12% in 2024/25 and 13% in 2025/26. For charities it fell from 9% to 7% in the latest year (CSBS 2025/26).
- Larger organisations are far more active. 91% of large businesses, 81% of medium businesses and 80% of high-income charities took at least one of the listed actions, against 52% of businesses overall (CSBS 2025/26). DSIT does not publish the penetration testing line by size in the report text; the breakdown sits in the annex tables.
- Among the 18% of businesses that ran a vulnerability audit, 39% used external contractors only and 28% did it in-house only. Micro (36%), small (47%) and medium (44%) businesses mostly used an external provider alone, while 57% of large businesses audited both internally and externally (CSBS 2025/26).
- Risk assessments among small businesses fell from 48% to 41% in a year (CSBS 2025/26).
- 15% of businesses reviewed the cyber risks posed by their immediate suppliers and 6% looked at the wider supply chain; for large businesses the figures were 48% and 24% (CSBS 2025/26).
- 5% of businesses hold Cyber Essentials, up from 3%, including 35% of large and 12% of small businesses. 24% of businesses have technical controls in all five Cyber Essentials areas (CSBS 2025/26).
- 39,790 Cyber Essentials and 12,850 Cyber Essentials Plus certificates were issued in the year to August 2025, both up around 17%, with a 1.1% fail rate and 75% of certifications being renewals (NCSC Annual Review 2025). Cyber Essentials Plus is the closest thing the UK has to a mass-market technical test, since it includes an authenticated vulnerability scan of a sample of devices.
- 43% of UK businesses and 28% of charities identified a breach or attack in the last 12 months, rising to 65% of medium and 69% of large businesses (CSBS 2025/26).
Have a think about the gap between those last two sets of figures. Roughly two thirds of medium and large businesses were attacked in the year, and the survey suggests well under half of them tested their own defences. The NCSC describes a penetration test as “a method for gaining assurance in the security of an IT system by attempting to breach some or all of that system’s security, using the same tools and techniques as an adversary might” (NCSC, Penetration testing guidance), which is a fair description of what the untested two thirds are missing.
Suggested Read: Cyber Security Statistics
2. The UK penetration testing industry: firms, people, jobs and pay
There is no official count of UK penetration testing companies, but DSIT’s annual sectoral analysis categorises every identified cyber security firm by what it sells, and CREST and the NCSC publish figures for accredited and assured providers.
Firms and revenue
- The UK cyber security sector contains 2,603 firms, up 20% from 2,165 after 438 new firms were identified; it generated £14.7 billion of revenue, up 11%, and gross value added of around £9.1 billion, up 17% (DSIT Cyber Security Sectoral Analysis 2026, published 12 May 2026, mainly using 2024/25 accounts).
- 35% of the 2,494 providers with identified products and services offer penetration testing and red teaming, which works out at roughly 870 firms. 80% offer cyber professional services and 45% offer threat intelligence, monitoring, detection and analysis; firms can sit in several categories (DSIT Sectoral Analysis 2026, Figures 2.6 and 2.7).
- 58% of UK cyber firms are micro businesses, 19% small, 13% medium and 9% large (DSIT Sectoral Analysis 2026, Table 2.1).
- 33% of UK cyber security office locations are in London, 16% in the South East and 9% in the North West (DSIT Sectoral Analysis 2026, Figure 3.1).
- CREST, the accreditation body for penetration testing providers, has “over 500 accredited and quality assured members” across six global regions and has awarded around 6,000 professional certifications (CREST, What we do, read October 2026).
- Around 500 companies offer NCSC-badged services, 128 Cyber Advisors work across the UK, 402 Cyber Essentials certification bodies were active (up 12.3%) and 39 providers were assured under the Cyber Incident Exercising scheme (NCSC Annual Review 2025). The NCSC does not publish a count of CHECK companies or CHECK tests.
Jobs, skills and pay
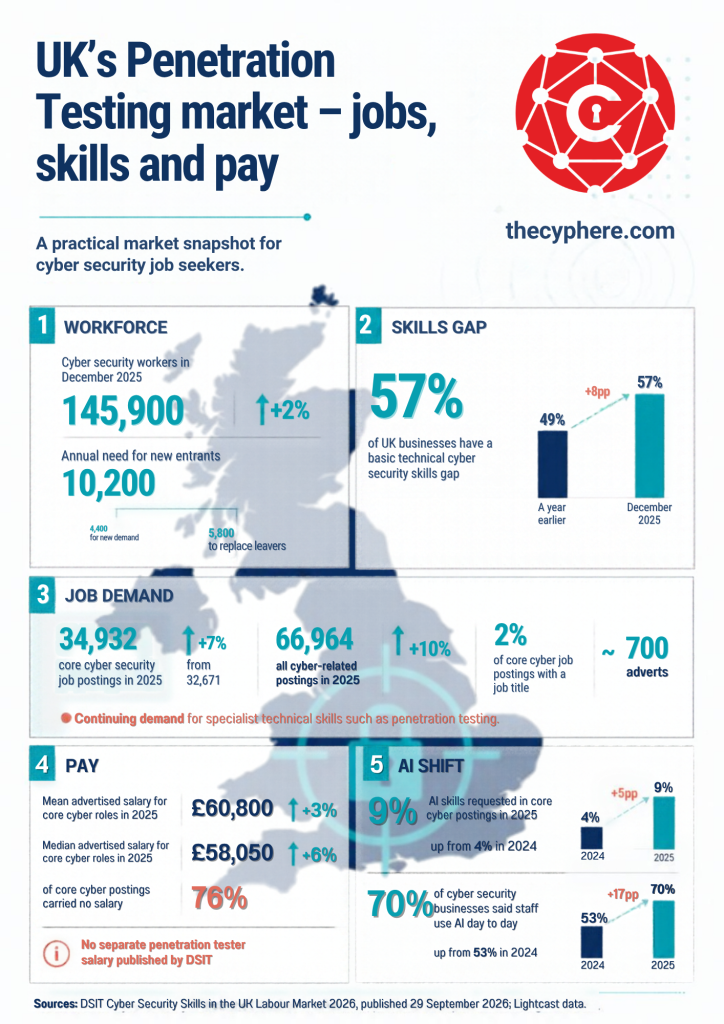
- The UK cyber security workforce was about 145,900 people in December 2025, up 2%, and DSIT estimates the sector needs around 10,200 new entrants a year, 4,400 for new demand and 5,800 to replace leavers (DSIT Cyber Security Skills in the UK Labour Market 2026, published 29 September 2026).
- 57% of UK businesses have a basic technical cyber security skills gap, up from 49% a year earlier (DSIT Skills 2026).
- There were 34,932 job postings for core cyber security roles in 2025, up 7% from 32,671, and 66,964 for all cyber-related roles, up 10% (DSIT Skills 2026, Lightcast data).
- Penetration testers made up 2% of core cyber job postings with a job title in 2025, around 700 adverts. DSIT’s qualitative interviews reported “continuing demand for specialist technical skills such as penetration testing” (DSIT Skills 2026).
- The mean advertised salary for core cyber roles was £60,800 in 2025, up 3%, and the median £58,050, up 6%; 76% of core cyber postings carried no salary at all (DSIT Skills 2026). DSIT does not publish a separate penetration tester salary, and we have dropped the unsourced salary figures that appeared on earlier versions of this page.
- AI skills were requested in 9% of core cyber postings in 2025, up from 4% in 2024, and 70% of cyber security businesses said staff use AI in their day-to-day work, up from 53% (DSIT Skills 2026).
3. Vulnerability statistics: CVEs, exploited vulnerabilities and severity
Penetration testing exists because software ships with flaws. The CVE system assigns an identifier to each publicly disclosed vulnerability, the NVD enriches the records, and CISA’s Known Exploited Vulnerabilities (KEV) catalogue records the ones confirmed as used in real attacks. The CVE.org and NVD dashboards are rendered in the browser and cannot be quoted directly, so we counted the records ourselves through the NVD API on 11 October 2026.
| Year | CVEs published (NVD publication date) | Added to CISA KEV in the year | Of which carried that year’s CVE ID |
|---|---|---|---|
| 2023 | 30,949 | 187 | not counted |
| 2024 | 40,704 | 186 | 39 (2024 IDs) plus older |
| 2025 | 49,972 | 245 | 151 |
| 2026 to 8 or 10 October | 78,831 | 255 | 169 |
Sources: our count via the NVD API (CVEs, to 10 October 2026) and our count of the CISA KEV JSON feed (catalogue version 2026.10.08). KEV counts use the date each entry was added.
- 49,972 CVEs were published in 2025, about 137 a day, up 23% on 2024 and 61% on 2023 (our NVD count).
- 78,831 CVEs were published between 1 January and 10 October 2026, already 58% more than the whole of 2025, including 37,712 in the third quarter alone (our NVD count). The NVD publication date reflects when a record reached the NVD, so part of any surge can be backlog processing; in a one-week sample from August 2026, 97% of records carried a 2026 identifier, so most of the volume is new.
- 15,074 CVEs were published in September 2026. Of the 13,573 that carried a CVSS score, 11% were critical, 46% high, 38% medium and 5% low (our count of the NVD records for September 2026, read 11 October 2026).
- 4,390 of those September 2026 records (29%) carried a CVSS v4 score, three years after the standard was released (our NVD count).
- The NVD is not keeping up. By 11 October 2026, 38% of the CVEs published in September carried the NVD status “Deferred” (the NVD will not enrich them), 28% had been fully analysed and 31% were still received, awaiting or undergoing analysis (our NVD count).
- CISA’s KEV catalogue held 1,739 vulnerabilities on 8 October 2026. 245 entries were added in 2025, up 32% on the 186 added in 2024, and 255 were added in 2026 by 8 October (our KEV count).
- Only 151 of the 245 vulnerabilities added to KEV in 2025 had a 2025 CVE identifier. The other 94 (38%) were older flaws, some dating back to 2007, that attackers were still exploiting (our KEV count).
- Set against the 49,972 CVEs published in 2025, the 151 same-year KEV additions represent 0.3% of the year’s output (our NVD and KEV counts).
- 31 of the 2025 KEV additions (13%) and 27 of the 2026 additions to date are flagged as known to be used in ransomware campaigns (our KEV count).
- Across 2025 and 2026 to date, Microsoft accounts for 78 KEV additions, Cisco 26, Apple 18, Fortinet 16, Linux 15, Google 15, Ivanti 12 and Citrix 11 (our KEV count). Four of those eight vendors make the VPN, firewall and remote access products that sit on the network edge.
- FIRST, which runs the Exploit Prediction Scoring System, states that the KEV catalogue lists roughly 0.5% of published CVEs and that exploitation activity is seen for roughly 2.5% to 3% of published CVEs in any 30-day window. EPSS scores every CVE daily; FIRST notes that the 0.10 threshold commonly used in the field “carries no special authority from EPSS” (FIRST EPSS FAQ, read October 2026).
- The NCSC’s update-by-default guidance sets the benchmark for UK patching: updates to internet-facing services and software within 5 days, operating systems and applications within 7 days, and internal or air-gapped software within 14 days, “regardless of the vulnerability severity”. When exploitation is widespread, the NCSC says those timescales “are too long” and that an internet-facing service should be checked for compromise before it is patched (NCSC, Vulnerability management guidance).
The practical reading of this table is that the volume problem has run away from any team that treats CVSS as a to-do list. What matters is the few hundred flaws a year that are exploited, where they sit in your estate and whether they are reachable; a penetration test is one of the few ways to answer the last two questions.
Suggested Read: Active Directory Penetration Testing
4. How attackers actually get in: exploitation as the initial access vector
The incident responders’ data is the best check on whether vulnerability exploitation matters in practice. The two largest incident datasets published in 2026 agree that it now leads; the UK ransomware survey does not, and we give both.
- Vulnerability exploitation was the initial access vector in 31% of breaches in the Verizon DBIR 2026, overtaking credential abuse (13%) and phishing (16%) for the first time. The dataset covers more than 31,000 incidents and 22,000 confirmed breaches between 1 November 2024 and 31 October 2025 (Verizon DBIR 2026, published May 2026, global).
- The previous DBIR put exploitation at 20% of breaches, so it rose by about half in a year. The 2025 edition also found that only 54% of edge-device and VPN vulnerabilities were fully remediated during the year, with a median of 32 days to do it (Verizon DBIR 2025, April 2025, baseline).
- Only 26% of CISA KEV vulnerabilities were fully remediated in the 2026 DBIR dataset, down from 38%, and the median time to full remediation rose from 32 to 43 days (Verizon DBIR 2026, as reported by SC Media and Tenable; see the author notes).
- Ransomware was present in 48% of all breaches, up from 44%, and the human element in 62% (Verizon DBIR 2026).
- Exploits were the most common initial infection vector for the sixth consecutive year, at 32% of the intrusions Mandiant investigated in 2025. Voice phishing was second at 11%, prior compromise third at 10%, and email phishing fell to 6% (Mandiant M-Trends 2026, published 23 March 2026, global).
- The global median dwell time rose to 14 days from 11, and 52% of intrusions were first detected internally, up from 43% (M-Trends 2026).
- Mandiant estimates the mean time to exploit vulnerabilities at minus 7 days: on average, exploitation now starts before a patch exists, and threat groups “deliberately target edge and core network devices, such as VPNs and routers, that typically lack standard EDR telemetry” (M-Trends 2026).
- 90 zero-day vulnerabilities were exploited in the wild in 2025, up from 78 in 2024 and below the record 100 in 2023. 43 (48%) were in enterprise software and appliances, and about half of those, 21, were in security and networking products (Google Threat Intelligence Group, 2025 zero-day review, published 5 March 2026).
- In the UK, exploited vulnerabilities were the technical root cause of 18% of ransomware attacks in 2026, down from 36% a year earlier, behind compromised credentials (28%), malicious email (25%) and phishing (22%). 35% of UK victims said an unknown security gap contributed and 33% a known one (Sophos State of Ransomware in the UK 2026, 120 UK respondents; small sample, treat the year-on-year swing with care).
- The NCSC’s Early Warning service sent vulnerability reports covering 187,000 IP addresses belonging to 4,030 UK organisations in the year to August 2025, and 13,178 organisations were signed up by year end (NCSC Annual Review 2025).
The lesson in these numbers is not that every vulnerability matters. It is that the ones on the edge of the network matter a great deal, that attackers are quicker to exploit them than most organisations are to patch, and that the Sophos “unknown security gap” line describes exactly what a penetration test is for.
Suggested Read: Malware Statistics
5. What penetration tests find, and how fast it gets fixed
The testing platforms that publish their own engagement data give the clearest picture of what comes out of a test. The figures below are platform data, so they describe each vendor’s customers rather than the whole market, and we have labelled them as such.
Findings and remediation
- 12% of all findings across Cobalt’s dataset of more than 16,500 pentests on nearly 3,000 organisations over five years are rated high risk (Cobalt State of Pentesting 2026, published April 2026, platform data).
- A typical organisation eventually resolves 86% of its high-risk findings, but only 52% are remediated within the five-year window of the dataset (Cobalt 2026).
- The best-performing organisations have a high-risk finding half-life of 10 days (the time to fix half of them); the bottom tier’s half-life is 249 days, an eight-month difference (Cobalt 2026).
- Organisations with a programmatic testing approach resolve 45% of critical findings within three days, against 10% for compliance-driven testers, and are 4.5 times more likely to do so (Cobalt 2026).
- In the previous edition, organisations resolved 48% of all pentest findings and 69% of serious findings, leaving 31% of serious findings unresolved (Cobalt State of Pentesting 2025, published 14 April 2025, analysed by the Cyentia Institute).
- Mean time to remediate high and critical vulnerabilities was 74.3 days across Edgescan’s platform in 2024: 54.8 days for applications and APIs and 72.1 days for devices and networks, with a range from under a day to 293 days (Edgescan Vulnerability Statistics Report 2025).
- 11% of the vulnerabilities on Edgescan’s platform were critical, 22% high, 44% medium, 8% low and 15% informational; on the web application and API layer, 9% were critical and 5.8% high (Edgescan 2025).
- SQL injection was still the most common critical or high web and API finding at 19.5% of such findings, with malicious file upload at 9.4% (Edgescan 2025).
AI and LLM testing
- 32% of findings from AI and LLM penetration tests are rated high risk, nearly 2.7 times the 12% overall rate, and only 38% of those high-risk AI findings are fixed, the lowest resolution rate of any application type (Cobalt 2026).
- One in five organisations experienced an LLM security incident in the last year; a further 18% were unsure and 19% declined to answer (Cobalt 2026 survey of 450 security professionals).
- Confidence in keeping up with the security implications of AI fell from 64% to 51% in a year, and 61% of respondents wanted a “strategic pause” on AI adoption, up from 48% (Cobalt 2026).
- A year earlier, 32% of tests on generative AI web applications found a serious vulnerability, and only 21% of those serious findings were fixed (Cobalt 2025).
- On HackerOne’s bug bounty platform, valid reports of prompt injection rose 540% in 2025, AI vulnerability reports rose by more than 200%, 1,121 customer programmes had AI in scope (up 270%) and autonomous AI agents submitted more than 560 valid reports. Programmes paid out $81 million in bounties, up 13% (HackerOne, 1 October 2025, platform data).
- Authorisation flaws including improper access control and IDOR were rising on HackerOne, while cross-site scripting and SQL injection reports were declining (HackerOne, 2025).
OWASP Top 10 2025
OWASP published the 2025 edition of its Top 10 web application risks in November 2025, built from data on more than 2.8 million applications and 589 CWEs from twelve named contributors; eight categories came from the data and two from the community survey. OWASP does not publish incidence percentages alongside the list, so we give it as a list:
- A01 Broken Access Control
- A02 Security Misconfiguration
- A03 Software Supply Chain Failures (new)
- A04 Cryptographic Failures
- A05 Injection
- A06 Insecure Design
- A07 Authentication Failures
- A08 Software or Data Integrity Failures
- A09 Security Logging and Alerting Failures
- A10 Mishandling of Exceptional Conditions (new)
What we find
In our own penetration testing work at Cyphere we keep anonymised counts of finding classes across engagements, and the pattern matches the platform data above more often than not. The figures below are from our engagements between January,2022 and December,2025 and are updated with this page.
- 35% of tests produced at least one critical finding and 78% at least one high.
- The five most common finding classes were input validation and rate limiting in web apps and APIs, lack of hardening measures (misconfigurations), active directory password controls and weak access controls.
- 31% of critical findings in external tests were on internet-facing web applications, 7% in the cloud security assessments and the remaining identified during internal assessments.
- Pen testing retests showed very encouraging results. More than 90% of the critical and high risk issues were fixed within 5 to 10 business days where there was one of these reasons associated with why engagement was commenced: SaaS assurance, enterprise contract, customer assurance or compliance deadline.
6. Why organisations test, how often, and who does it
The survey data on why organisations test is almost all North American, and the most-cited series, Fortra’s annual Penetration Testing Report, has not published a 2025 or 2026 edition that we could find. The figures below are the latest available, labelled with their geography.
- 82% of respondents said penetration testing’s main purpose was to assess risk and prioritise vulnerabilities for remediation, 74% to support a vulnerability management programme, 72% to prove adherence to regulations or external mandates and 54% to meet internal mandates (Fortra Penetration Testing Report 2024, US-weighted survey).
- 72% said penetration testing had prevented a breach at their organisation (Fortra 2024).
- 43% tested once or twice a year, up 5 points, and 17% never tested, up 3 points; quarterly testing fell 9 points (Fortra 2024).
- 92% used a third-party tester in some capacity and 35% used third parties exclusively, up 16 points; 62% chose an outside firm for an external, objective view and 56% because compliance required it. The commonest reason for having no in-house team was “not enough need to employ a full-time pen tester” (55%) (Fortra 2024).
- The top challenge was a lack of resources to act on findings, cited by 62%, followed by an inability to hire skilled staff (34%) and a lack of qualified third parties (34%) (Fortra 2024).
- 70% of US enterprises with 3,000 or more staff test at most twice a year, while 96% change their infrastructure at least quarterly; only 30% test as often as they change. The average annual pentesting budget was about $187,000, roughly 10.5% to 11% of the security budget (Pentera State of Pentesting 2025, 500 CISOs and senior executives, surveyed January 2025, US-weighted).
- Only 9% of security professionals would rely entirely on automation for security testing, down from 29% a year earlier; 47% prefer a hybrid model and 78% reported critical false negatives from fully automated scanning (Cobalt AI and Pentesting Pulse Report 2026, 455 respondents, as summarised by Bright Defense; see the author notes).
- 61% of software customers now ask for third-party pentest reports to validate a supplier’s security, up 13 points year on year (Cobalt 2026).
- In the UK, the one official data point on who does the testing is the CSBS audit split: 39% of businesses that ran a vulnerability audit used an external provider only, 28% did it in-house only, and 57% of large businesses did both (CSBS 2025/26).
Our view is that the frequency numbers are the ones to act on. Infrastructure changes quarterly or faster in most organisations, exploitation of new flaws now starts before the patch, and an annual test leaves eleven months of unmeasured change. A gap means a risk not yet assessed or measured, and the practical answer for most UK organisations is an annual full test plus a targeted retest after each significant change, rather than a bigger annual test.
Suggested Read: Cyber Insurance Statistics
Frequently asked questions
What percentage of UK businesses do penetration testing?
13% of UK businesses and 7% of UK charities carried out penetration testing in the 12 months before the Cyber Security Breaches Survey 2025/26, up from 11% of businesses in the 2024 edition. 18% of businesses ran a vulnerability audit and 30% a risk assessment covering cyber security.
How many vulnerabilities are published each year?
49,972 CVEs were published in 2025 and 78,831 between 1 January and 10 October 2026, by our count of the NVD records. Of those, only a few hundred a year are confirmed as exploited: CISA added 245 vulnerabilities to its Known Exploited Vulnerabilities catalogue in 2025 and 255 in 2026 to 8 October.
What proportion of breaches start with an exploited vulnerability?
31% in the Verizon DBIR 2026, which made exploitation the leading initial access vector for the first time, and 32% of the intrusions Mandiant investigated in 2025. In UK ransomware cases, Sophos put exploited vulnerabilities at 18% of technical root causes in 2026, behind compromised credentials at 28%.
How often should a penetration test be done?
The survey data shows most organisations test once or twice a year (43% in Fortra’s 2024 survey) while 96% of large enterprises change their infrastructure at least quarterly (Pentera 2025). The NCSC expects internet-facing updates within 5 days and Mandiant now estimates exploitation starts before a patch exists, so the useful pattern is an annual test plus a retest after significant change.
How quickly do organisations fix what a penetration test finds?
Slowly. The mean time to remediate high and critical findings was 74 days on Edgescan’s platform in 2024, the median time to fully remediate a KEV vulnerability rose from 32 to 43 days in the DBIR 2026 dataset, and Cobalt reports that only 52% of high-risk findings are resolved within five years, with a half-life of 249 days for the worst-performing organisations.
How much do penetration testers earn in the UK?
DSIT does not publish a penetration tester salary. Its 2026 labour market report gives a mean advertised salary of £60,800 and a median of £58,050 for core cyber security roles in 2025, and penetration testers were 2% of the 34,932 core cyber job postings that year.
About this data
This page draws on reports published between January 2025 and October 2026. UK take-up figures are from the DSIT Cyber Security Breaches Survey 2025/26 (fieldwork August to December 2025, published 30 April 2026), with the 2024 and 2025 editions used for the trend. Industry and workforce figures are from DSIT’s Cyber Security Sectoral Analysis 2026 (May 2026) and Cyber Security Skills in the UK Labour Market 2026 (September 2026), CREST and the NCSC Annual Review 2025. Vulnerability counts are our own: CVE totals were counted through the NVD API by publication date on 11 October 2026 in quarterly ranges, the severity and CVSS v4 shares come from every NVD record published in September 2026, and KEV figures come from the CISA KEV JSON feed, catalogue version 2026.10.08, counted by the date each entry was added. Incident data is from Verizon, Mandiant, Google Threat Intelligence Group and Sophos; testing data is from Cobalt, Edgescan, HackerOne, Fortra and Pentera, which describe their own customers rather than the whole market. Where a report covers several countries we have said so in the line.
The market-size forecasts, LinkedIn hashtag counts, unsourced OWASP mobile percentages, US salary figures and 2020 to 2022 vulnerability figures that appeared in previous versions of this page have been removed. We refresh this page after each Cyber Security Breaches Survey (April), each DSIT sectoral analysis (May), each DBIR and M-Trends release, and we re-run the CVE and KEV counts at each refresh.
If you cite a figure from this page, please link to the original source as well as to us; the references are below.
References
- DSIT, Cyber Security Breaches Survey 2025/26 (30 April 2026)
- DSIT, Cyber Security Breaches Survey 2025 (April 2025)
- DSIT, Cyber Security Breaches Survey 2024 (April 2024)
- NCSC Annual Review 2025
- DSIT, Cyber Security Sectoral Analysis 2026 (12 May 2026)
- CREST, What we do
- DSIT, Cyber Security Skills in the UK Labour Market 2026 (29 September 2026)
- NIST National Vulnerability Database, API 2.0 (counts taken 11 October 2026)
- CISA, Known Exploited Vulnerabilities catalogue and JSON feed
- FIRST, EPSS frequently asked questions
- Edgescan, 2025 Vulnerability Statistics Report (January 2025)
- NCSC, Penetration testing guidance
- NCSC, Vulnerability management: put in place a policy to update by default
- Verizon, 2026 Data Breach Investigations Report
- Verizon, 2025 Data Breach Investigations Report
- Mandiant, M-Trends 2026 (23 March 2026)
- Google Threat Intelligence Group, 2025 zero-day exploitation review (5 March 2026)
- Sophos, State of Ransomware in the UK 2026
- Cobalt, State of Pentesting Report 2026
- Cobalt, State of Pentesting 2026 press release (21 April 2026)
- Cobalt, State of Pentesting 2025 press release (14 April 2025)
- HackerOne, report finds 210% spike in AI vulnerability reports (1 October 2025)
- OWASP Top 10:2025
- Fortra, 2024 Penetration Testing Report
- Pentera, The State of Pentesting 2025 survey report
- Bright Defense, summary of Cobalt AI and Pentesting Pulse Report 2026